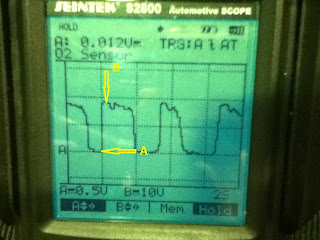
MAP Sensor
Volt/division/range 0.5V
Time/division/range 1s
Draw the pattern below:Explain the operation of the sensor or device using the Graph:
Point A: The engine WOT; in the intake manifold negative pressure low the voltage going up, the voltage 1.7V
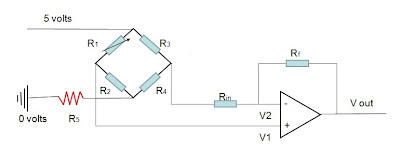
Point B: The engine idle; in the intake manifold negative pressure high and the voltage drop, the voltage 0.2VExplain in detail an electrical fault that would make this unit operate incorrectly, this picture below showing R5 is as a resistance to the ground.
Bad earth the only reason possible of resistance on the earth wire. This is why the output signal voltage is low.
Explain why this condition would cause this unit to malfunction/ Use mathematical equations to back up your explanation
Let's we calculate with and without bad earth:
All the value from lesson 4:
R1=10K R2=28K R3=10K R4=4K R5=5K Rf=10K Rin=5K
Formula: Vout=(V1-v2)Rf/Rin,
Bad earth:
V1={Vcc/(R1+R2+R5)}*(R2+R5)V1={5V/(10K+28K+5K)}*(28K+5K)
V1={5V/43K}*33K
V1=3.837V
V1={Vcc/(R3+R4+R5)}*(R4+R5)
V1={5V/(10K+4K+5K)}*(4k+5k)
V1={5V/19K}*9K
V1=2.368V
Vout1=(3.837V-2.368V)*2
Vout1=2.938V
No bad earth:
V2={Vcc/(R1+R2)}*R2V2={5V/(10K+28K)}*28K
V2={5V/38K}*28K
V2=3.684V
V2={Vcc/(R3+R4)}*R4
V2={5V/(10K+4K)}*4K
V2={5V/14K}*4K
V2=1.428V
Vout2=(3.684V-1.428V)*2
Vout2=4.512V
If we look at the sample above by math calculation which is the bad earth voltage output lower than voltage without bad earth by comparison (2.938V/4.512V)*100%=65.1% so 1/3 lower than normal. The pattern looks like:
TPS Linear type
Volt/division/range 0.5V
Time/division/range 1S
Draw the pattern below:
Explain the operation of the sensor or device using the Graph:
Point A, throttle butterfly is closed idle condition. Point A-B, accelerate the engine and throttle butterfly starting open and increase voltage signal out. Point B-C, the engine decelerate throttle butterfly starting close and decrease voltage signal out. Point C the engine idle condition again and throttle butterfly is closed.
Comparison between normal condition and have a bad earth:(picture from lesson4)
Without bad earth:
Giving 0.5V at idle condition or closed throttle.
Calculation:
I=Vref/R I=5V/5000Ohm
I=0.001A
Resistance above: 5000Ohm-500Ohm=4500Ohm
Voltage drop on the resistance: 0.001A*4500Ohm=4.5V
Voltage at point4: 5V-4.5V=0.5V
With bad earth:
Calculation:
I=V/Rtot
I=5V/(5000Ohm+300Ohm)
I=5V/5300Ohm
I=0.0009A
Resistance above:5000Ohm-500Ohm=4500Ohm
Voltage drop on the resistance:0.0009A*4500Ohm=4.05V
Voltage at point4: 5V-4.244V=0.95V
So, the bad earth with the 300Ohm resistance almost give us 2 times higher than normal.
The pattern looks like:
The TPS give higher voltage when got the bad earth, the higher voltage than normal. ECU think running on high speed and ECU tell to injector to spray more fuel into combustion, the engine will be running rich mixture.
ECT
Volt/division/range 0.5V
Time/division/range 50mS
Draw the pattern below:
Explain the operation of the sensor or device using the Graph:
The pattern above saying the engine looks good because when we taking the pattern capture the engine was warm and tend to be hot. The reason warm, we did couples experiment before. As the principle ECT(thermistor) when temperature increase the resistance decrease, resistance decrease and the voltage will be decreased.
Comparison between normal condition and have a bad earth:(picture from lesson4)
Without bad earth:
Calculation:
I=Vref/Rtot
I=5V/2750Ohm
I=0.0018A
Voltage drop: 0.0018A*2500Ohm=4.54V
Voltage at point2: 5V-4.54V=0.45V
With bad earth:
Calculation:
I=Vref/Rtot
I=5V/50000Ohm
I=0.0001A
Voltage drop in PCM: 0.0001A*2500Ohm=0.25V
Voltage at point2: 5V-0.25V=4.75V
The pattern looks like:
With bad earth resistance 40K, the voltage different almost 10 times higher, pattern above just example higher than normal because can not draw 10 times higher on the scale 0.5V.
Bad earth causing high voltage to the ECU, ECU think the engine still cold condition(resistance high) and ECU tell to the injector to spray fuel more into combustion and the engine will running rich.
IAT
Volt/division/range 5V
Time/division/range 5S
Draw the pattern below:
Explain the operation of the sensor or device using the Graph:
The pattern above looks like a line only, characteristic of IAT is thermistor similar as ECT but different usability. In running condition still the same like ECT, possible running rich because the ECU receive high voltage and think the engine running cold spraying more fuel into combustion.
RPM(ac magnetic crank or distributor)
Volt/division/range 5V
Time/division/range 1mS
Draw the pattern below:
Explain the operation of the sensor or device using the Graph:
From B-A, the tooth start coming closer to the magnetic pick up. Point A, the tooth exactly opposite to the magnetic pick up, this is the smallest gap in between and produce the highest voltage. Point C, the tooth move away from magnetic field and the gap start bigger, the voltage drop down and back EMF happen at this point. Frequency and voltage output send to ECU, and ECU adjust the ignition timing.
RPM(cam or distributor)
Volt/division/range 2V
Time/division/range 20mS
Draw the pattern below:
Explain the operation of the sensor or device using the Graph:
From B-A, the tooth start coming closer to the magnetic pick up. Point A, the tooth exactly opposite to the magnetic pick up, this is the smallest gap in between and produce the highest voltage. Point C, the tooth move away from magnetic field and the gap start bigger, the voltage drop down and back EMF happen at this point.
This unit telling the position of the cam and speed of the cam. By the RPM speed produce the voltage, higher speed is equal higher voltage. Also cam position control the firing time.
Oxygen Sensor
Volt/division/range 0.5V
Time/division/range 2S
Draw the pattern below:
Explain the operation of the sensor or device using the Graph:
The pattern above saying the engine running in the close loop rich at point B 0.9V and lean at point A 0.1V. We did not get the perfect sine wave because the ECU is aftermarket one. The engine still running good even not using the original ECU but by oscilloscope we can see actual the oxygen sensor it self, which is running good or bad. If we using original ECU possible produce the perfect sine-wave.
Ignition Timing Control
Volt/division/range 2V
Time/division/range 10mS
Draw the pattern below:
Explain the operation of the sensor or device using the Graph:
Point A is no signal 0V
Point B there is ignition timing signal about 6V, we have got the digital Ignition timing where is digital signal is sent by ECU to to trigger the transistor make it "on" and close circuit. Ignition Primary
Volt/division/range 50V
Time/division/range 1.2mS
Draw the pattern below:
Explain the operation of the sensor or device using the Graph:
Point A is Dwell time: primary coil is grounded and the current coming through to the coil to charge the magnetic field.
Point B is Firing voltage: the magnetic field collapse in the primary coil and create high voltage to cross jump between electrode to the ground.
Point C is burn time: time is needed for energy dissipated.
Point D is Oscillation. Injector
Volt/division/range 10V
Time/division/range 5mS
Draw the pattern below:
Explain the operation of the sensor or device using the Graph:
Point A: Voltage available and start drop down.
Point B-C: The circuit is grounded and injector start spraying.
Point C: The circuit off and injector stop spraying
Point D: The coil is off, magnetic field is collapse and generate the spark.The important thing of the injector is earth trigger and PWM signal, where is the PWM trigger the transistor to close the circuit.
Idle Air
Volt/division/range 10V
Time/division/range 5S
Draw the pattern below:
Explain the operation of the sensor or device using the Graph:
We use 2 channel for capture these 2 coil create opposite magnetic filed control open and close the valve. Picture above did not get the right waveform possible because of ECU is aftermarket, should be exactly opposite each other like mirror. PWM signal is the one control the IAC from ECU. The digital signal for both of those showing off and on of each valve.


No comments:
Post a Comment