Tuesday, July 5, 2011

WS3 Oscilloscope Patterns to Capture


MAP Sensor
Volt/division/range 0.5V
Time/division/range 1s
Draw the pattern below:
Explain the operation of the sensor or device using the Graph:
Point A: The engine WOT; in the intake manifold negative pressure low the voltage going up, the voltage 1.7V
Point B: The engine idle; in the intake manifold negative pressure high and the voltage drop, the voltage 0.2V


Explain in detail an electrical fault that would make this unit operate incorrectly, this picture below showing R5 is as a resistance to the ground.

Bad earth the only reason possible of resistance on the earth wire. This is why the output signal voltage is low.

Explain why this condition would cause this unit to malfunction/ Use mathematical equations to back up your explanation
Let's we calculate with and without bad earth:
All the value from lesson 4:
R1=10K  R2=28K  R3=10K  R4=4K  R5=5K  Rf=10K  Rin=5K
Formula: Vout=(V1-v2)Rf/Rin,  
Bad earth:
V1={Vcc/(R1+R2+R5)}*(R2+R5)
V1={5V/(10K+28K+5K)}*(28K+5K)
V1={5V/43K}*33K
V1=3.837V
V1={Vcc/(R3+R4+R5)}*(R4+R5)
V1={5V/(10K+4K+5K)}*(4k+5k)
V1={5V/19K}*9K
V1=2.368V
Vout1=(3.837V-2.368V)*2
Vout1=2.938V
No bad earth:
V2={Vcc/(R1+R2)}*R2
V2={5V/(10K+28K)}*28K
V2={5V/38K}*28K
V2=3.684V
V2={Vcc/(R3+R4)}*R4
V2={5V/(10K+4K)}*4K
V2={5V/14K}*4K
V2=1.428V
Vout2=(3.684V-1.428V)*2
Vout2=4.512V
If we look at the sample above by math calculation which is the bad earth voltage output lower than voltage without bad earth by comparison (2.938V/4.512V)*100%=65.1% so 1/3 lower than normal. The pattern looks like:


TPS Linear type 
Volt/division/range 0.5V
Time/division/range 1S
Draw the pattern below:
Explain the operation of the sensor or device using the Graph:
Point A, throttle butterfly is closed idle condition. Point A-B, accelerate the engine and throttle butterfly starting open and increase voltage signal out. Point B-C, the engine decelerate throttle butterfly starting close and decrease voltage signal out. Point C the engine idle condition again and throttle butterfly is closed.  
 

Comparison between normal condition and have a bad earth:(picture from lesson4)
Without bad earth:
Giving 0.5V at idle condition or closed throttle.
Calculation:
I=Vref/R
I=5V/5000Ohm
I=0.001A
Resistance above: 5000Ohm-500Ohm=4500Ohm
Voltage drop on the resistance: 0.001A*4500Ohm=4.5V
Voltage at point4: 5V-4.5V=0.5V

With bad earth:
Calculation:
I=V/Rtot
I=5V/(5000Ohm+300Ohm)
I=5V/5300Ohm
I=0.0009A
Resistance above:5000Ohm-500Ohm=4500Ohm
Voltage drop on the resistance:0.0009A*4500Ohm=4.05V
Voltage at point4: 5V-4.244V=0.95V 
So, the bad earth with the 300Ohm resistance almost give us 2 times higher than normal.
The pattern looks like:
The TPS give higher voltage when got the bad earth, the higher voltage than normal. ECU think running on high speed and ECU tell to injector to spray more fuel into combustion, the engine will be running rich mixture.


ECT
Volt/division/range 0.5V
Time/division/range 50mS
Draw the pattern below:

Explain the operation of the sensor or device using the Graph:
The pattern above saying the engine looks good because when we taking the pattern capture the engine was warm and tend to be hot. The reason warm, we did couples experiment before. As the principle ECT(thermistor) when temperature increase the resistance decrease, resistance decrease and the voltage will be decreased.


Comparison between normal condition and have a bad earth:(picture from lesson4)
Without bad earth:
Calculation:
I=Vref/Rtot
I=5V/2750Ohm
I=0.0018A
Voltage drop: 0.0018A*2500Ohm=4.54V
Voltage at point2: 5V-4.54V=0.45V
With bad earth:
Calculation:
I=Vref/Rtot
I=5V/50000Ohm
I=0.0001A
Voltage drop in PCM: 0.0001A*2500Ohm=0.25V
Voltage at point2: 5V-0.25V=4.75V

The pattern looks like: 


With bad earth resistance 40K, the voltage different almost 10 times higher, pattern above just example higher than normal because can not draw 10 times higher on the scale 0.5V.
Bad earth causing high voltage to the ECU, ECU think the engine still cold condition(resistance high) and ECU tell to the injector to spray fuel more into combustion and the engine will running rich.


IAT
Volt/division/range 5V
Time/division/range 5S
Draw the pattern below:
Explain the operation of the sensor or device using the Graph:
The pattern above looks like a line only, characteristic of IAT is thermistor similar as ECT but different usability. In running condition still the same like ECT, possible running rich because the ECU receive high voltage and think the engine running cold spraying more fuel into combustion.  


RPM(ac magnetic crank or distributor) 
Volt/division/range 5V
Time/division/range 1mS
Draw the pattern below:

Explain the operation of the sensor or device using the Graph:
From B-A, the tooth start coming closer to the magnetic pick up. Point A, the tooth exactly opposite to the magnetic pick up, this is the smallest gap in between and produce the highest voltage. Point C, the tooth move away from magnetic field and the gap start bigger, the voltage drop down and back EMF happen at this point. Frequency and voltage output send to ECU, and ECU adjust the ignition timing.


RPM(cam or distributor)
Volt/division/range 2V
Time/division/range 20mS
Draw the pattern below:

Explain the operation of the sensor or device using the Graph:
From B-A, the tooth start coming closer to the magnetic pick up. Point A, the tooth exactly opposite to the magnetic pick up, this is the smallest gap in between and produce the highest voltage. Point C, the tooth move away from magnetic field and the gap start bigger, the voltage drop down and back EMF happen at this point. 
This unit telling the position of the cam and speed of the cam. By the RPM speed produce the voltage, higher speed is equal higher voltage. Also cam position control the firing time.


Oxygen Sensor
Volt/division/range 0.5V
Time/division/range 2S
Draw the pattern below:
Explain the operation of the sensor or device using the Graph:
The pattern above saying the engine running in the close loop rich at point B 0.9V and lean at point A 0.1V. We did not get the perfect sine wave because the ECU is aftermarket one. The engine still running good even not using the original ECU but by oscilloscope we can see actual the oxygen sensor it self, which is running good or bad. If we using original ECU possible produce the perfect sine-wave.


Ignition Timing Control

Volt/division/range 2V
Time/division/range 10mS
Draw the pattern below:

Explain the operation of the sensor or device using the Graph:
Point A is no signal 0V
Point B there is ignition timing signal about 6V, we have got the digital Ignition timing where is digital signal is sent by ECU  to to trigger the transistor make it "on" and close circuit. 


Ignition Primary
Volt/division/range 50V
Time/division/range 1.2mS
Draw the pattern below:

Explain the operation of the sensor or device using the Graph:
Point A is Dwell time: primary coil is grounded and the current coming through to the coil to charge the magnetic field.
Point B is Firing voltage: the magnetic field collapse in the primary coil and create high voltage to cross jump between electrode to the ground.
Point C is burn time: time is needed for energy dissipated.
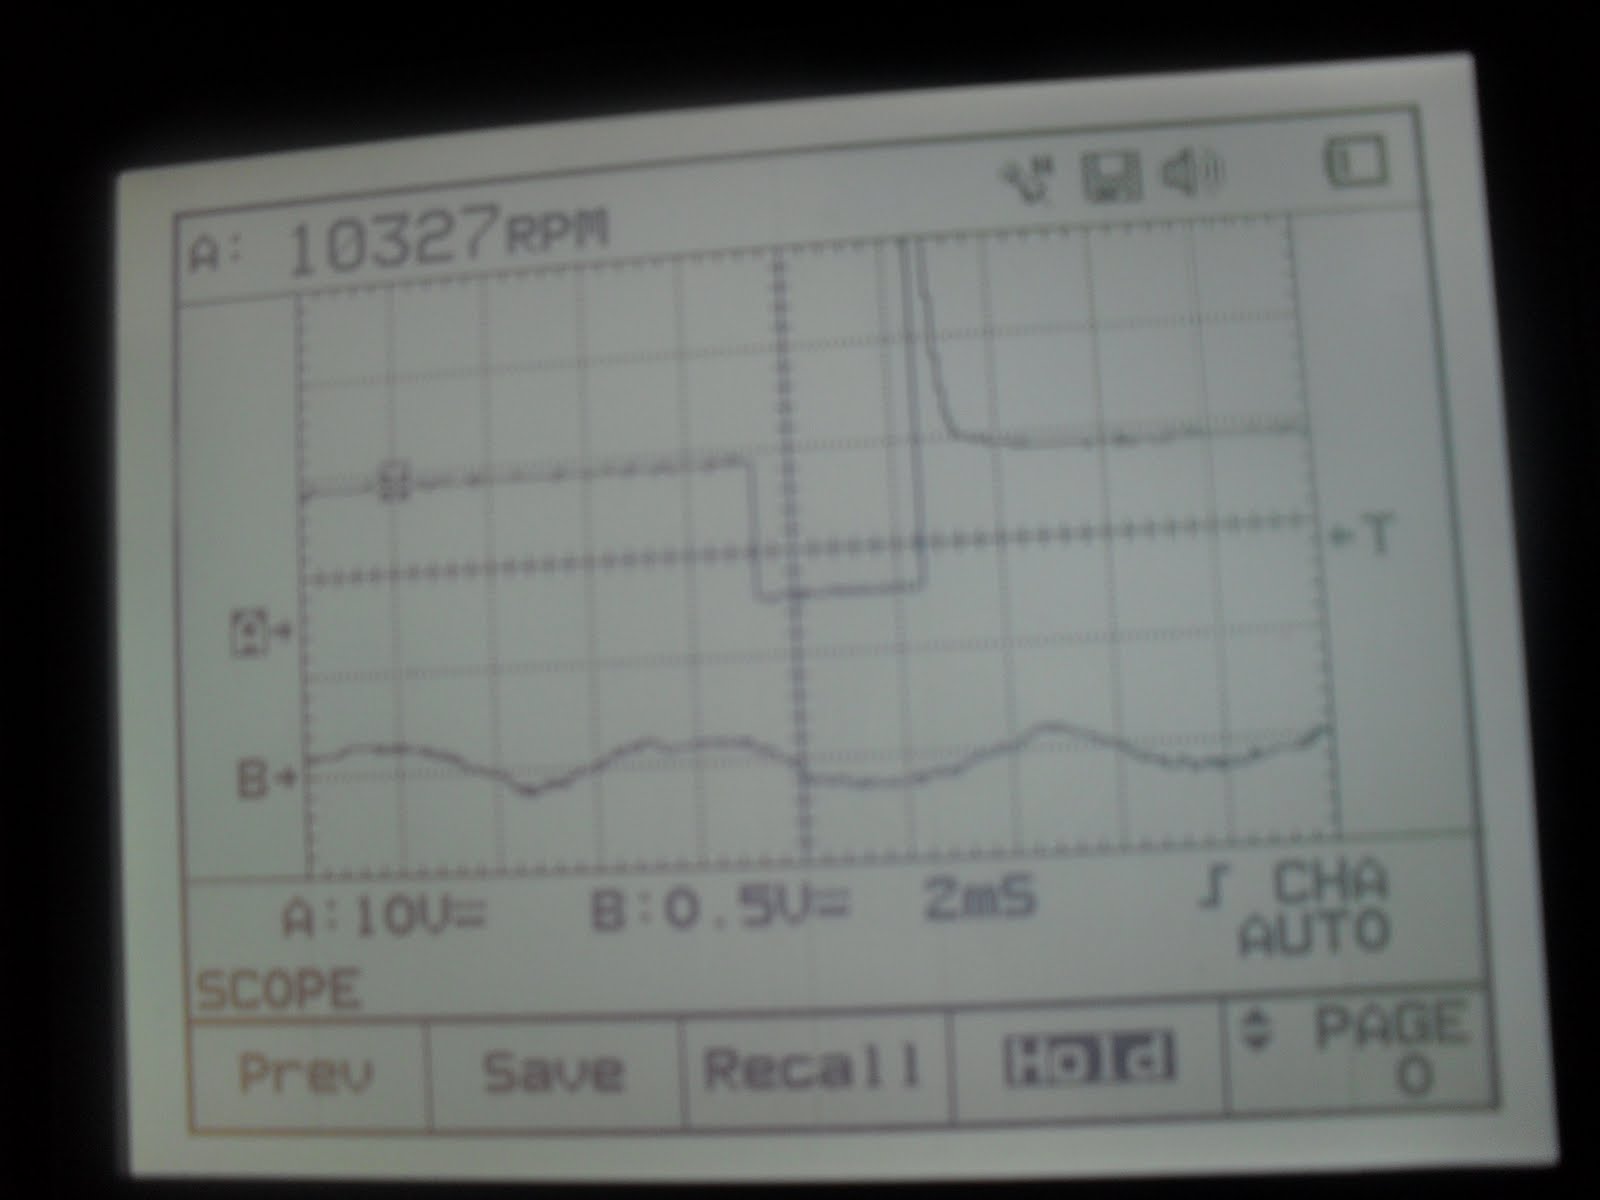
Point D is Oscillation.


Injector
Volt/division/range 10V
Time/division/range 5mS
Draw the pattern below:

Explain the operation of the sensor or device using the Graph:
Point A: Voltage available and start drop down.
Point B-C: The circuit is grounded and injector start spraying.
Point C: The circuit off and injector stop spraying
Point D: The coil is off, magnetic field is collapse and generate the spark.
The important thing of the injector is earth trigger and PWM signal, where is the PWM trigger the transistor to close the circuit.


Idle Air

Volt/division/range 10V
Time/division/range 5S
Draw the pattern below:

Explain the operation of the sensor or device using the Graph:
We use 2 channel for capture these 2 coil create opposite magnetic filed control open and close the valve. Picture above did not get the right waveform possible because of ECU is aftermarket, should be exactly opposite each other like mirror. PWM signal is the one control the IAC from ECU. The digital signal for both of those showing off and on of each valve.

Sunday, July 3, 2011

WS3b Using Dual Trace Oscilloscope

MAP (analogue voltage) against Injectors (petrol) 
Volt/division/range: MAP sensor=2V and Injector=20V
Time/division/range: 10mS
Draw the pattern below:

Explain the operation of the sensors or Actuators using the Graph:
The MAP sensor is saying 3V running at higher RPM. When running at higher RPM, vacuum on the MAP sensor decrease and voltage will be increased. The voltage increase sending to the ECU, ECU knows the engine will be running in the higher RPM and open the injector should be longer.


RPM (Hall digital crank or distributor) against Injectors (petrol)
Volt/division/range: Injector=10V and RPM=5V
Time/division/range: 20mS
Draw the pattern below: 
Running idle:
Revving Up:
Explain the operation of the sensor or Actuator using the Graph:
When we revv-up the engine, frequency getting short and voltage getting higher. Means the engine running rich mixture and the injector open longer, rotation on the engine automatically running faster. The inductive pick up in the RPM sensor on distributor, spinning of the pick up coil running faster too due the engine running faster.   


Oxygen sensor against Injectors (petrol)
Volt/division/range: Injector=10V and O2=0.5V
Time/division/range: 2mS
Draw the pattern below:

Explain the operation of the sensor or Actuator using the Graph:
Open injector effect to the engine running rich or lean. When engine running rich mixture, the peak to peak pattern of oxygen sensor will maximum reach 0.9V at the time injector open longer, and opposite if the injector open short oxygen sensor tell us running lean the voltage only 0.1V. The pattern above is saying oxygen sensor at 0.4V roughly that the injector start open longer until close loop. After the engine have a load, oxygen sensor send signal to ECU to command to the injector open longer. 


Ignition primary against Injectors (petrol)
Volt/division/range: Injector=10V and Ignition=20V
Time/division/range: 5mS
Draw the pattern below:

Explain the operation of the sensor or Actuator using the Graph:
Relationship between the primary ignition and injector where the ignition is set to open and close the injector to spray petrol into the combustion chamber. When we accelerate, the injector open time longer so that the engine speed automatically increase the signal sent to ECU. And ECU adjust ignition timing.


Ignition primary voltage against Ignition primary current
Volt/division/range: Ignition voltage=20V and Ignition Current=0.5V
Time/division/range: 2mS
Draw the pattern below:

Explain the operation of the sensor or Actuator using the Graph: 
The current clamp was setting to 20A (100mV/A) which mean maximum from the pattern 0.475V=475mV base on 100mV/A; 475mV/100mV/A=4.75A. So the current on the ignition primary was 4.75A. When the magnetic filed charge up by closing circuit to the ground, the current start flowing in the primary winding. And the current start fill up the capacitor to build up the voltage reach around 300V and the current stop; release the voltage at that time firing voltage happen and then circuit open magnetic collapse. When the voltage drop to the ground or we call dwell time, the current start to charging up.
Ref:
http://mgaguru.com/mgtech/ignition/ig108.htm

Sunday, June 26, 2011

WS8 Primary & Secondary Ignition Patterns

Make Toyota Corolla 4A-FE
Warning: Ignition coils create high voltage. It can be dangerous, so avoid getting too close to ignition parts when engine is running. Make your connections when the engine is off, and then keep your distance when the engine is running. Even some primary voltage is high enough
to stop a “Pacemaker”.
Also: Do not run engines with secondary ignition HT leads “open circuit”. Make sure they are grounded to engine through a spark plug, grounding wire, or spark tester.
If you have problems with the task, see you lecturer for help.

1.0 Primary Voltage Patterns
1.1 Set up a lab scope or ignition oscilloscope to view the primary ignition pattern (in parade or display mode) on your lab scope, with the engine warmed up and idling.
1.2 Record the average Firing Voltage (or “Step Up voltage) for each cylinder in the chart below. Some variation is normal, just pick the average. If you don’t understand what this is, review the resource information available.
1.3 Record the average Burn Voltage for each cylinder in the chart below.
1.4 Record the average Burn Time in milliseconds for each cylinder in the chart below.
1.5 Record the average Dwell Time for each of the cylinders in the chart below.

1.6 Are all these primary ignition voltage readings normal? Yes.
Please discuss what is normal and what causes it?
Obviously each cylinder have the same pattern, if we notice carefully only cylinder 1 have little bit different other about after burning time, so far I can say it is normal and have back EMF. May be causing the spark plug worn.  


Cyl 1
Cyl 2
Cyl 3
Cyl 4
Primary Ignition
250+250+250+250+Firing Voltage (V)
40.740.740.740.7Burn Voltage (V)
1.011.011.011.01Burn Time(ms)
5.355.255.415.45Dwell Time(ms)


1.7 Draw or photograph the Primary Ignition oscilloscope parade pattern from your scope into the box below. Do it carefully and show the detail you need to see for diagnosis.

1.8 Discuss what the primary display or parade pattern emphasizes for diagnosis. What can it help you see?
From the oscilloscope above:
Point A is Dwell time: primary coil is grounded and the current coming through to the coil to charge the magnetic field.
Point B is Firing voltage: the magnetic field collapse in the primary coil and create high voltage to cross jump between electrode to the ground.
Point C is burn time: time is needed for energy dissipated.
Point D is Oscillation.
1.10 Some scopes have the facility to use raster or stacked display. How could this help you to diagnose a fault. What can you see more clearly?
Possible of misfiring, bad earth, checking the burning time and we can compare the electrode firing on the spark plug for each cylinder. All these effect to engine performance.

2.0 Secondary Voltage Patterns.
2.1 Set up your ignition oscilloscope or lab scope to view the secondary ignition patterns on your lab scope, with the engine warmed up and idling. (Use parade mode or individual mode on each different cylinder, depending on scope available.)
2.2 Record the average Firing Voltage (or “Step Up voltage) for each cylinder in the chart below. Some variation is normal, just pick the average. If you don’t understand what this is, review the resource information at the back of this worksheet.
2.3 Record the average Burn Time for each cylinder in the chart below. Are all these secondary ignition voltage readings normal? Yes. 
Cylinder 1:
Firing Voltage: 6.4KV and Burn Time: 1.39ms

Cylinder 2:
Firing Voltage: 5.2KV and Burn Time: 1.32ms
Cylinder 3:
Firing Voltage: 6.2KV and Burn Time: 1.19ms

Cylinder 4:
Firing Voltage: 6.1KV and Burn Time: 1.45ms

2.3 Record the average Burn Time for each cylinder in the chart below. Are all these secondary ignition voltage readings normal? Yes. 
Discuss what is happening in the pattern and what it is telling you about the ignition system.
To create the spark jump across from electrode to ground need high voltage and short time.

2.5 Do a Snap Acceleration (don’t damage the engine by revving too high or for too long) and record in the chart below how high the Firing Voltage (KV) went under Snap Acceleration.
The pattern below showing one of 4 cylinder:

Cyl 1Cyl 2Cyl 3Cyl 4Secondary Ignition
12.112.314.115.2Firing Voltage (KV)
0.220.140.120.15Burn Time (ms)
12151415Snap Acceleration(KV)

2.6 Are all these Snap Acceleration secondary ignition voltage readings normal? Yes.

Discuss what is happening and what the pattern is telling you.
When we snap acceleration, fuel and air more coming than idle, at the time electron need energy to jump across, automatically firing voltage going higher and burning time less and less. Why less? because the energy burned will quickly disappear. 

2.7 Draw or photograph the Secondary Ignition lab scope pattern while idling from your scope into the box below. Do it carefully and show the detail you need to see for diagnosis.

2.8 If you can safely do this, (with the engine stopped), gently disconnect one spark plug wire, and short to the engine with a jumper wire. Which cylinder number did you short? 4
2.9 Start the engine and let it idle (for only a short time.) Record the new Firing Voltage and Burn Time for all the cylinders in the chart below.
Cyl 1Cyl 2Cyl 3Cyl 4Secondary Ignition (one cylinder grounded)
6.87.17.116.9Firing Voltage (KV)
1.451.321.370.7Burn Time (ms)


2.10 Draw or photograph the shorted Secondary Ignition waveform you see now on your scope.

2.11 Discuss what is happening in the shorted ignition pattern and how the ignition pattern tells you what it is happening in the ignition system.
On cylinder no 4 firing voltage higher and the burning time shortest than other 3 because the ground  wire has been shorted to the engine and in the same time need high voltage to push or force the spark across, automatically burn time will be short.

2.12 Remove the ground wire and attach the spark plug wire back on the engine so it is normal again. Run the engine a bit to clear the spark plug.
2.13 Stop the engine and attach a spark tester to another spark plug wire. Start the engine and let it idle (for only a short time). 

Record the new Firing Voltage and Burn Time for all the cylinders in the chart below.
Cyl 1Cyl 2Cyl 3Cyl 4Secondary Ignition (Spark tester on one cylinder)
5.913.35.65.31Firing Voltage (KV)
1.461.461.831.83Burn Time (ms)


2.14 Draw or photograph the spark tester Secondary Ignition waveform you see now on your scope.


2.16 Discuss what happens to the ignition waveform when the spark tester is attached to the spark plug wire. What does it tell you about the ignition system.
We remove the spark plug wire from cylinder 2 and attached spark tester, The spark park tester gap can be adjusted, the picture above (wider gap) test for the second time after we test the small gap. The spark still jump across but need higher voltage and the burn time will be short.  The table above showing the firing voltage higher than other.

2.17 Remove the spark tester carefully, and put everything back together on the engine. Engine runs fine? Yes.
Note: remember, all the experiment above about string theory where is the firing voltage high and the burn time will be short. Vice-versa.